
棒グラフを英語で説明する
Bar Chart (Column Chart)
どんなときに使うグラフか
棒グラフは英語で Bar Chart (Column Chart)。カテゴリー間の数量比較に使います。
会議やプレゼンでこのグラフを映したときに、そのまま言える4フレーズを用意しました。 導入・比較・着目点・締めの順に並んでいるので、上から読めば説明が1本つながります。
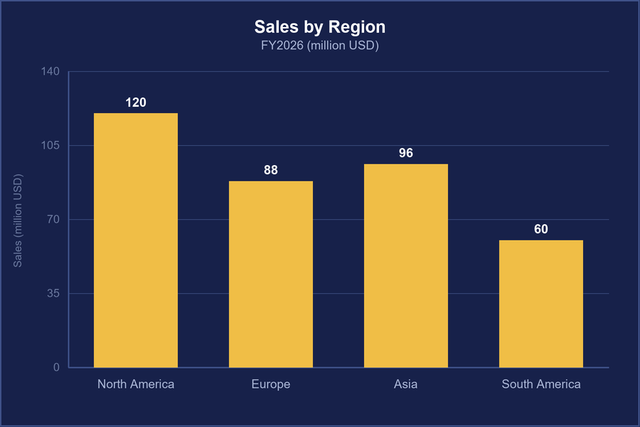
This bar chart compares sales across four regions.
この棒グラフは4つの地域にわたる売上を比較しています。
- compare A across B:AをB全体で比較する
- region:地域
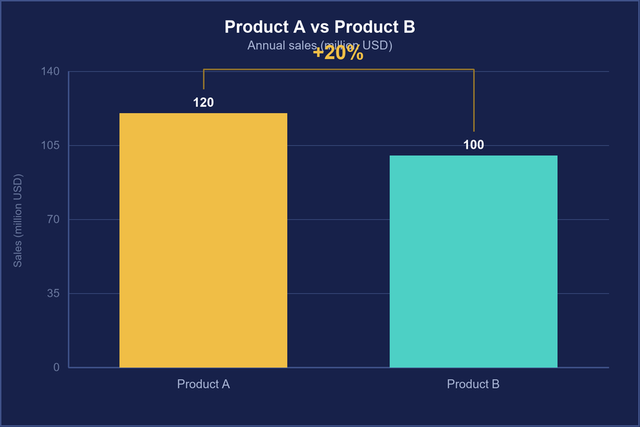
Product A outperformed Product B by 20 percent.
製品Aは製品Bを20%上回るパフォーマンスを示しました。
- outperform:~を上回る成績を出す
- by 20 percent:20%の差で
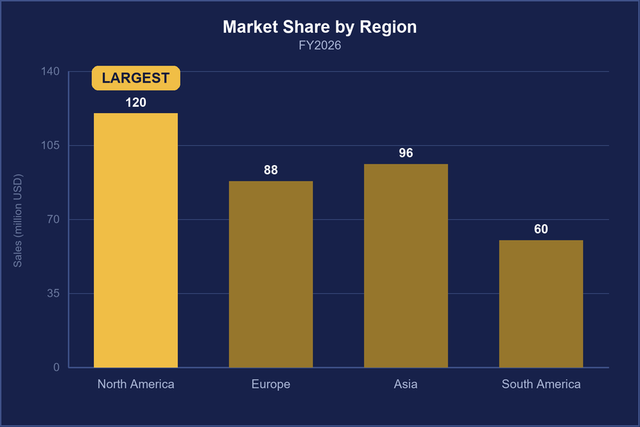
Notice how North America accounts for the largest bar.
北米が最も長い棒(最大のシェア)をしめている点にご注目ください。
- Notice how ...:~という点にご注目ください
- account for:~を占める
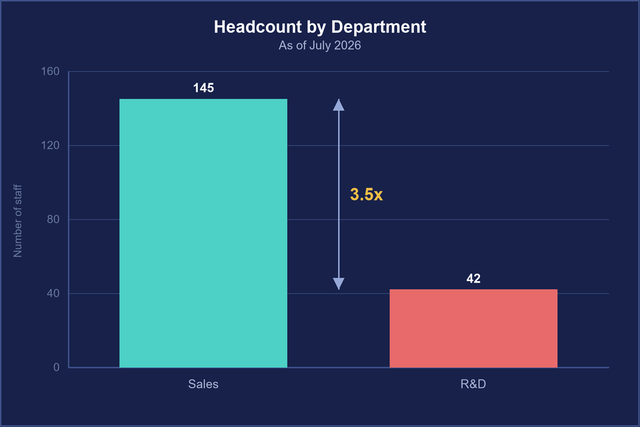
There is a striking contrast between the two departments.
2つの部門の間には際立った対比が見られます。
- a striking contrast:際立った対比
- department:部門
会議ではこう話す(4フレーズをつなげた説明例)
上の4フレーズ(太字)を1本の説明につなげると、こうなります。数字や名前は、自分の資料に合わせて入れ替えて使えます。
Let's look at regional sales for the first half. This bar chart compares sales across four regions.
上半期の地域別売上を見てみましょう。この棒グラフは、4つの地域の売上を比べたものです。
Notice how North America accounts for the largest bar. It's almost twice the size of Europe.
北米の棒がいちばん長い点にご注目ください。ヨーロッパのほぼ2倍です。
On the product side, Product A outperformed Product B by 20 percent, mainly because of the spring campaign.
製品別では、製品Aが製品Bを20%上回りました。主な理由は春のキャンペーンです。
And if we look at the teams, there is a striking contrast between the two departments. One hit its target, and the other came in 15 percent short.
そしてチーム別に見ると、2つの部門の差がはっきり出ています。一方は目標を達成し、もう一方は15%届きませんでした。
ポイント棒を比べるときは「いちばん長い」だけで終わらせず、almost twice(ほぼ2倍)や about half(約半分)のように、差の大きさを一言で添えると、聞き手が数字を読まなくても伝わります。
このあと聞かれやすい質問と、答え方
QWhat's driving the gap between North America and Europe?北米とヨーロッパの差は何が原因ですか?
AMostly deal size. We closed three large enterprise accounts in the U.S. this quarter.主に1件あたりの規模です。今四半期は米国で大口の法人顧客を3社獲得しました。
QIs this in revenue or units?これは金額ですか、数量ですか?
ARevenue, in millions of dollars. I should have labeled the axis more clearly.金額で、単位は百万ドルです。軸の表示をもっと分かりやすくすべきでした。
QHow does this compare to last year?昨年と比べてどうですか?
AAll four regions are up, but Europe grew the least, only 2 percent.4地域とも増えていますが、ヨーロッパの伸びがいちばん小さく、2%だけです。
ポイント軸の単位(金額か数量か、千か百万か)はよく聞かれます。聞かれたら素直に答え、次のスライドから単位を入れておけば十分です。
言い換えで伝わり方が変わる表現
| よくある言い方 | 伝わる言い方 | 理由 |
|---|---|---|
| North America is big. | North America has the highest sales, at 12 million dollars. | 何が大きいのか(売上)と数字を一緒に言うと、比べる基準がはっきりする |
| Product A is 20% bigger than Product B. | Product A outsold Product B by 20 percent. | bigger は大きさ。売上の差なら outsold や outperformed を使う |
| Sales of Asia is low. | Sales in Asia are the lowest of the four. | 地域は in で表し、sales は複数として扱う。「4つの中で最低」まで言うと位置が分かる |
| Please see the graph. | Take a look at the second bar from the left. | どの棒を見るのかを言葉で指すと、オンライン会議でも迷わない |
一緒に覚えたい言葉
| 英語 | 意味 | 使い方の例 |
|---|---|---|
| vertical / horizontal bar chart | 縦棒グラフ / 横棒グラフ | A horizontal bar chart works better for long labels. |
| x-axis / y-axis | 横軸 / 縦軸 | The y-axis shows revenue in millions. |
| account for | (割合・量を)占める | North America accounts for 40 percent of sales. |
| outperform | ~を上回る(成績で勝る) | Our team outperformed the forecast. |
| compared with | ~と比べて | Sales were up 8 percent compared with last year. |
| year over year (YoY) | 前年比 | Revenue grew 10 percent year over year. |
| fall short | (目標に)届かない | We fell short of our target by 5 percent. |