
データ表を英語で説明する
Data Table & Matrix
どんなときに使うグラフか
データ表は英語で Data Table & Matrix。詳細な数値データの照合・多指標の一覧比較に使います。
会議やプレゼンでこのグラフを映したときに、そのまま言える4フレーズを用意しました。 導入・比較・着目点・締めの順に並んでいるので、上から読めば説明が1本つながります。
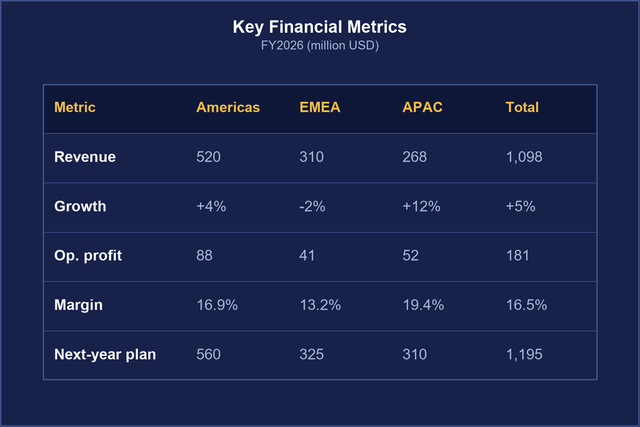
This table summarizes the key financial metrics.
この表は主要な財務指標をまとめています。
- summarize:要約する・まとめる
- financial metrics:財務指標
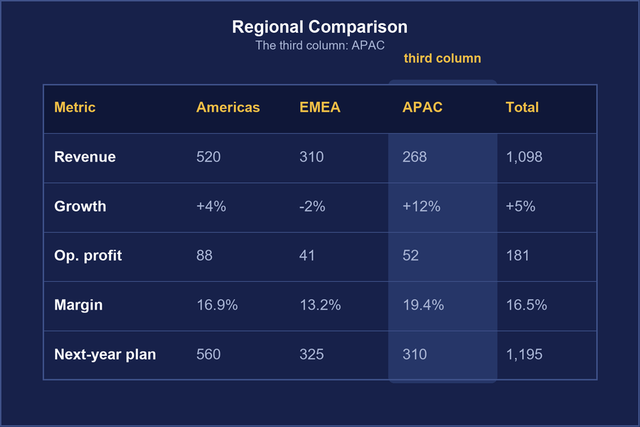
If you look at the third column, APAC shows positive growth.
3列目を見ると、アジア太平洋地域がプラス成長を示しています。
- the third column:3列目
- positive growth:プラス成長
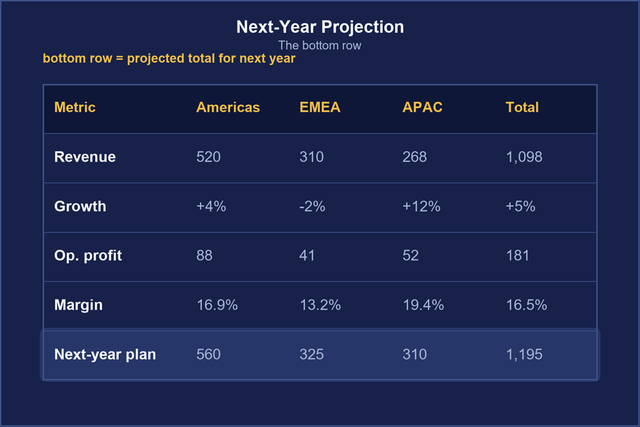
The bottom row indicates our projected total for next year.
最下行は来年度の予想合計を示しています。
- the bottom row:最下行
- projected total:予想合計
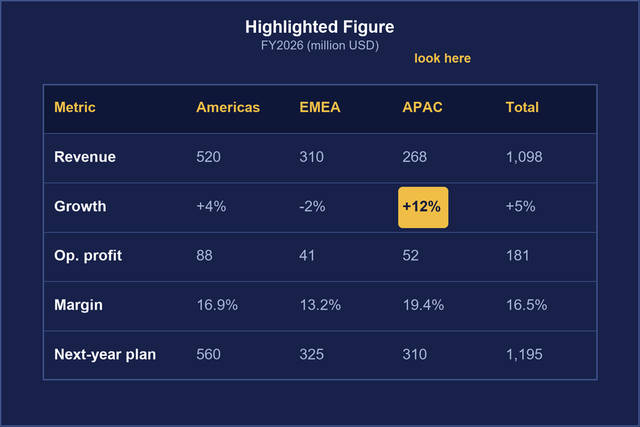
Let me direct your attention to the highlighted figure.
ハイライトされた数字にご注目いただきたいと思います。
- direct your attention to:~に注目していただく
- figure:数字
会議ではこう話す(4フレーズをつなげた説明例)
上の4フレーズ(太字)を1本の説明につなげると、こうなります。数字や名前は、自分の資料に合わせて入れ替えて使えます。
Rather than a chart, I'll use a table here, because the exact numbers matter. This table summarizes the key financial metrics for each region: revenue, growth, and operating margin.
ここでは正確な数字が大事なので、グラフではなく表を使います。この表は、地域ごとの主要な財務指標、つまり売上・伸び率・営業利益率をまとめたものです。
If you look at the third column, APAC shows positive growth, at 6 percent, while the other two regions are slightly down.
3列目を見ると、アジア太平洋地域は6%のプラス成長で、ほかの2地域はわずかにマイナスです。
The bottom row indicates our projected total for next year.
いちばん下の行は、来年度の見込みの合計です。
Let me direct your attention to the highlighted figure, the 9 percent margin in APAC. That's the highest we've ever had there.
強調表示した数字にご注目ください。アジア太平洋地域の利益率9%です。この地域では過去最高です。
ポイント表は、聞き手がどこを見ればよいか迷いやすい資料です。third column(3列目)、bottom row(いちばん下の行)のように、場所を言葉で案内してから中身を話すと、全員が同じ数字を見られます。
このあと聞かれやすい質問と、答え方
QAre these figures audited?この数字は監査済みですか?
ANot yet. These are preliminary numbers. The audited figures will be ready in mid-November.まだです。これは速報値で、監査済みの数字は11月中旬にそろいます。
QWhat assumptions are behind the projection?見込みの前提は何ですか?
AMainly 4 percent market growth and no major currency swings. I can share the details after the meeting.主に市場の4%成長と、大きな為替変動がないことです。詳しくは会議のあとでお送りします。
QCould you send me the table?表を送ってもらえますか?
AOf course. I'll send the Excel file so you can filter it yourself.もちろんです。ご自身で絞り込めるように、Excelファイルでお送りします。
ポイント数字の表では「確定値か速報値か」「見込みの前提は何か」が必ず聞かれます。preliminary(速報の)と projected(見込みの)を使い分けて答えると、数字の確からしさが正しく伝わります。
言い換えで伝わり方が変わる表現
| よくある言い方 | 伝わる言い方 | 理由 |
|---|---|---|
| Please see the number. | Please look at the third column, second row. | どの数字かを列と行で指すと、オンライン会議でも全員が同じ所を見られる |
| This number is important. | Let me draw your attention to this figure. | 注目してほしいときは draw your attention to が自然。数字そのものは figure と言う |
| next year forecast total | the projected total for next year | 名詞を並べるだけにせず、the ... for next year の形にすると文として伝わる |
| Only APAC is plus. | APAC is the only region with positive growth. | プラス・マイナスは positive / negative growth で言う |
一緒に覚えたい言葉
| 英語 | 意味 | 使い方の例 |
|---|---|---|
| column / row | 列 / 行 | The last column shows the change from last year. |
| cell | (表の)マス | The red cells are below target. |
| figure | 数字・数値 | These figures are in thousands of dollars. |
| metric | 指標 | Margin is the key metric for this meeting. |
| preliminary | 速報の・暫定の | These are preliminary results. |
| projected | 見込みの・予測の | Projected revenue is 40 million. |
| year to date (YTD) | 年初来(今年の累計) | Year to date, we're 5 percent ahead of plan. |