
複合グラフを英語で説明する
Combination Chart (Combo Chart)
どんなときに使うグラフか
複合グラフは英語で Combination Chart (Combo Chart)。2軸の異なる単位(棒グラフ+折れ線グラフ)の相互関係に使います。
会議やプレゼンでこのグラフを映したときに、そのまま言える4フレーズを用意しました。 導入・比較・着目点・締めの順に並んでいるので、上から読めば説明が1本つながります。
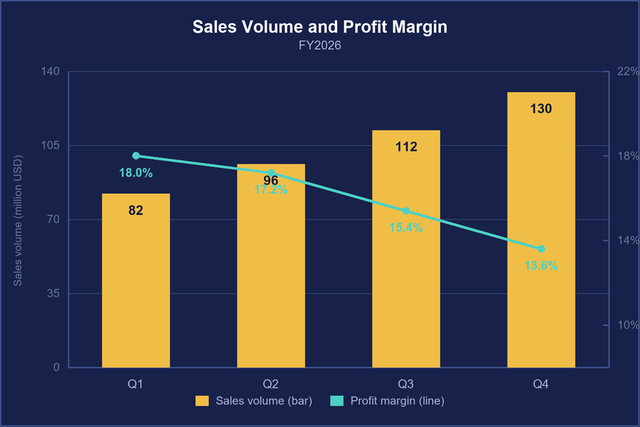
Bars show sales volume while the line tracks profit margin.
棒グラフは売上高を示し、折れ線グラフは利益率の推移を追っています。
- track:推移を追う
- profit margin:利益率
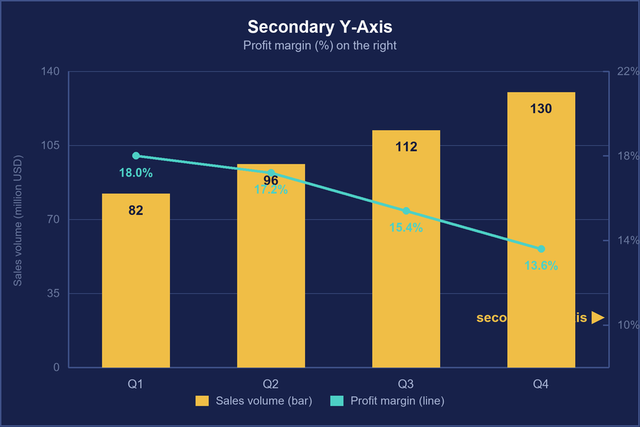
Please refer to the secondary Y-axis on the right.
右側の第2Y軸(右軸)をご参照ください。
- refer to:~を参照する
- secondary Y-axis:第2Y軸
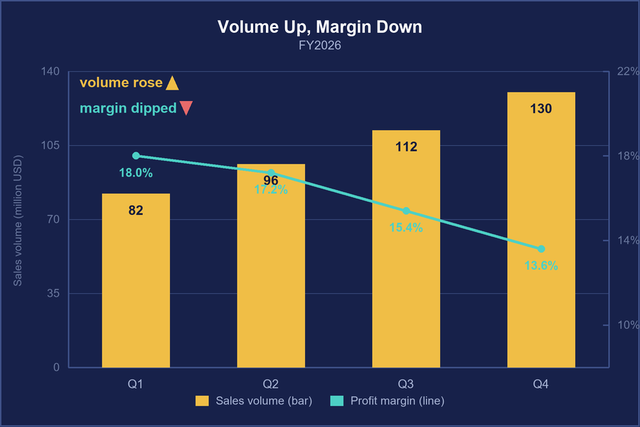
Even as volume rose, the profit margin dipped.
売上高(棒)が増加した一方で、利益率(線)は縮小しました。
- Even as ...:~する一方で
- dip:一時的に下がる
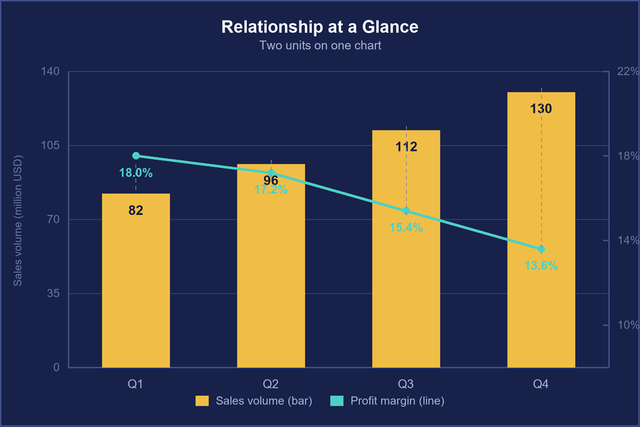
This combination graph highlights the relationship clearly.
この複合グラフは、その相互関係を分かりやすく強調しています。
- highlight:際立たせる
- relationship:相互関係
会議ではこう話す(4フレーズをつなげた説明例)
上の4フレーズ(太字)を1本の説明につなげると、こうなります。数字や名前は、自分の資料に合わせて入れ替えて使えます。
This chart puts two things on one slide. Bars show sales volume while the line tracks profit margin.
このグラフは、2つのことを1枚にまとめています。棒が販売数量、線が利益率の推移です。
For the margin, please refer to the secondary Y-axis on the right.
利益率については、右側の第2軸をご覧ください。
As you can see, even as volume rose, the profit margin dipped, from 18 percent to 14 percent over the year, mostly because of discounts.
ご覧のとおり、販売数量は増えた一方で、利益率は1年で18%から14%に下がりました。主な原因は値引きです。
This combination graph highlights the relationship clearly. We're selling more, but earning less on each unit.
この複合グラフで、2つの関係がはっきり分かります。たくさん売れてはいるものの、1個あたりのもうけは減っているということです。
ポイント軸が2本あるグラフは、最初に「どちらがどちらの軸か」を言うのがいちばん大事です。最後に We're selling more, but earning less.(多く売れているが、もうけは減っている)のように、2つの関係を一文にまとめると伝わります。
このあと聞かれやすい質問と、答え方
QWhich axis is which again?どちらがどちらの軸でしたか?
AVolume is on the left axis, in thousands of units, and the margin is on the right, in percent.数量が左の軸で単位は千個、利益率が右の軸でパーセントです。
QAre the discounts still running?値引きはまだ続いていますか?
AWe ended two of the three promotions in September, so we expect the margin to recover in Q4.3つのキャンペーンのうち2つを9月に終えたので、第4四半期には利益率が戻る見込みです。
QIs that gross margin or operating margin?それは粗利率ですか、営業利益率ですか?
AGross margin. The operating margin follows the same trend, but it's a few points lower.粗利率です。営業利益率も同じ動きですが、数ポイント低くなっています。
ポイント「利益率」は gross(粗利)か operating(営業利益)かで数字が変わるので、必ず確認されます。グラフのタイトルに入れておくか、聞かれたらすぐ答えられるようにしておきましょう。
言い換えで伝わり方が変わる表現
| よくある言い方 | 伝わる言い方 | 理由 |
|---|---|---|
| Sales up, profit down. | Sales volume rose, but the profit margin fell. | メモ書きのような言い方ではなく、主語と動詞のある文で、何が上がり何が下がったかを言う |
| the number on the right side | the secondary axis on the right | 右側の目盛りは secondary axis(第2軸)。左は primary axis |
| profit rate | profit margin | 「利益率」は profit margin が定番。profit rate はあまり使われない |
| two graphs in one | a combo chart / a dual-axis chart | 棒と線を重ねたグラフは combo chart。軸が2本あることを強調するなら dual-axis chart |
一緒に覚えたい言葉
| 英語 | 意味 | 使い方の例 |
|---|---|---|
| primary / secondary axis | 第1軸(左) / 第2軸(右) | Revenue uses the primary axis. |
| dual-axis chart | 2軸グラフ | A dual-axis chart can be confusing, so I'll explain the axes first. |
| sales volume | 販売数量 | Sales volume grew 15 percent. |
| profit margin | 利益率 | Our profit margin is 12 percent. |
| gross / operating margin | 粗利率 / 営業利益率 | Gross margin improved, but operating margin didn't. |
| dip | (一時的に)下がる | Margins dipped in the third quarter. |
| per unit | 1個あたり | We're earning less per unit. |