
ヒストグラムを英語で説明する
Histogram
どんなときに使うグラフか
ヒストグラムは英語で Histogram。データの度数分布(年齢層・価格帯ごとの分散)に使います。
会議やプレゼンでこのグラフを映したときに、そのまま言える4フレーズを用意しました。 導入・比較・着目点・締めの順に並んでいるので、上から読めば説明が1本つながります。
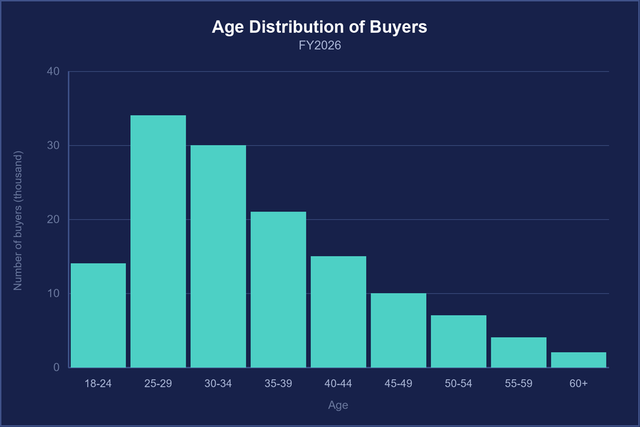
This histogram displays the age distribution of buyers.
このヒストグラムは購入者の年齢分布を示しています。
- distribution:分布
- buyer:購入者
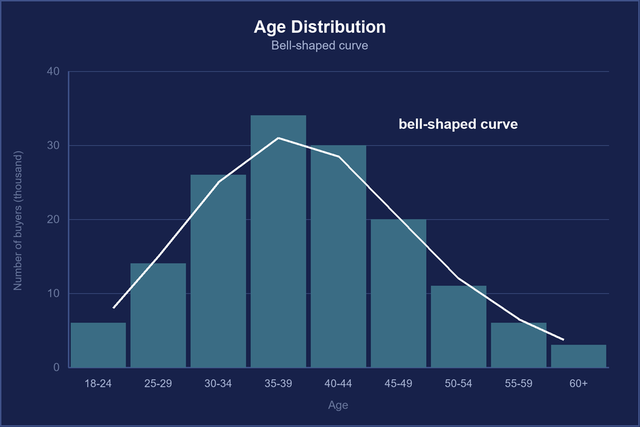
The data forms a classic bell-shaped curve.
データは典型的なベルカーブ(正規分布)を形成しています。
- form:形づくる
- bell-shaped curve:ベル型の曲線
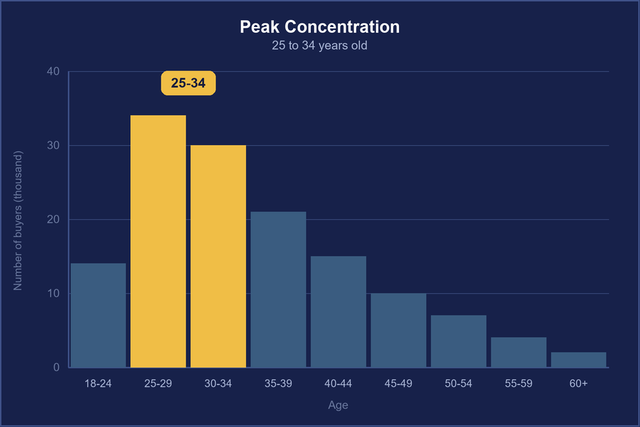
The peak concentration lies between 25 and 34 years old.
最も集中しているピークは25歳から34歳の間に位置しています。
- peak concentration:最も集中している部分
- lie between:~の間にある
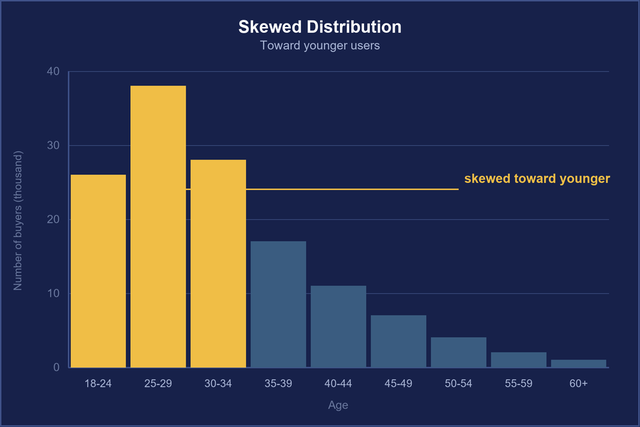
The distribution is heavily skewed toward younger users.
分布は若年層ユーザー側に大きく偏っています。
- be skewed toward:~に偏っている
- heavily:大きく
会議ではこう話す(4フレーズをつなげた説明例)
上の4フレーズ(太字)を1本の説明につなげると、こうなります。数字や名前は、自分の資料に合わせて入れ替えて使えます。
This shows who is actually buying our products. This histogram displays the age distribution of buyers, in five-year age bands.
実際にだれが買っているのかをお見せします。このヒストグラムは、購入者の年齢の分布を5歳きざみで示したものです。
The peak concentration lies between 25 and 34 years old.
いちばん集中しているのは、25歳から34歳の間です。
For our main product, the data forms a classic bell-shaped curve, so the typical buyer is around 30.
主力製品では、データがきれいなベルカーブ(釣り鐘型)になっていて、典型的な購入者は30歳前後です。
But for the new app, the distribution is heavily skewed toward younger users. Almost 70 percent of its buyers are under 30.
一方で新しいアプリは、分布が若い利用者側に大きく偏っています。購入者の7割近くが30歳未満です。
ポイントヒストグラムは棒グラフと似ていますが、横軸が「区間(bin)」です。最初に in five-year age bands(5歳きざみで)のように区間の幅を言うと、グラフの読み方が一度で伝わります。
このあと聞かれやすい質問と、答え方
QWhat's the median age?年齢の中央値はいくつですか?
AThirty-one. The average is slightly higher, at thirty-three, because of a small group of older buyers.31歳です。平均は少し高く33歳で、年配の購入者が少しいるためです。
QWhy five-year bands?なぜ5歳きざみなのですか?
AWith one-year bands the chart looked too noisy, and ten-year bands hid the peak.1歳きざみだとグラフがばらつきすぎて、10歳きざみだと山が見えなくなったからです。
QIs this based on all customers?これは全顧客のデータですか?
AIt's based on the 12,000 buyers who registered their birth year, which is about 80 percent of the total.生まれ年を登録している1万2,000人の購入者が対象で、全体の約8割です。
ポイント分布の話では median(中央値)と average / mean(平均)の違いがよく話題になります。偏りがあるときは中央値のほうが実態に近い、と一言そえられると説得力が出ます。
言い換えで伝わり方が変わる表現
| よくある言い方 | 伝わる言い方 | 理由 |
|---|---|---|
| Many buyers are 25 to 34. | Most buyers fall in the 25 to 34 age range. | 区間に入ることは fall in ... range で表すと、分布の説明らしくなる |
| Young people are many. | The distribution is skewed toward younger buyers. | 分布の偏りは be skewed toward。英語では「多い」を主語にしない |
| The average person is 30. | The typical buyer is around 30. | 「よくいる購入者像」は typical buyer。average person だと意味がぼやける |
| The graph is like a mountain. | The data forms a bell-shaped curve. | 山型の分布は bell-shaped curve(ベルカーブ)という決まった言い方がある |
一緒に覚えたい言葉
| 英語 | 意味 | 使い方の例 |
|---|---|---|
| distribution | 分布 | Let's look at the price distribution. |
| bin / band | 区間(ヒストグラムの1本分) | Each bin covers five years. |
| frequency | 度数・件数 | The y-axis shows the frequency. |
| skewed | 偏った | The data is skewed to the right. |
| normal distribution | 正規分布 | Test scores follow a normal distribution. |
| median / mean | 中央値 / 平均値 | The median is lower than the mean. |
| range | 範囲・幅 | Most orders fall in the 50 to 100 dollar range. |