
円グラフ・ドーナツ図を英語で説明する
Pie & Doughnut Chart
どんなときに使うグラフか
円グラフ・ドーナツ図は英語で Pie & Doughnut Chart。全体に対する各要素の構成比(割合・内訳)に使います。
会議やプレゼンでこのグラフを映したときに、そのまま言える4フレーズを用意しました。 導入・比較・着目点・締めの順に並んでいるので、上から読めば説明が1本つながります。
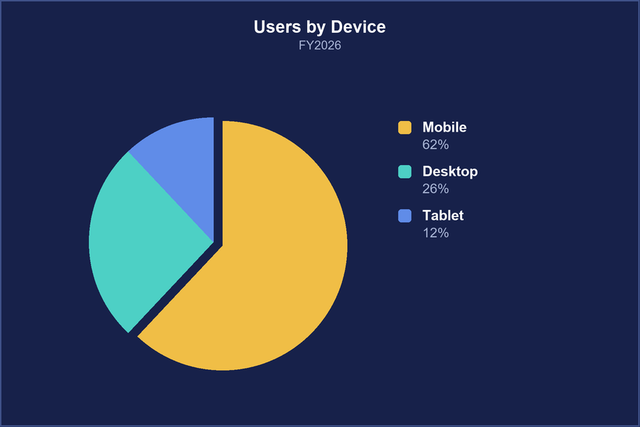
As you can see from this pie chart, mobile users dominate.
この円グラフからわかるように、モバイルユーザーが主流を占めています。
- As you can see from ...:~からわかるように
- dominate:大半を占める
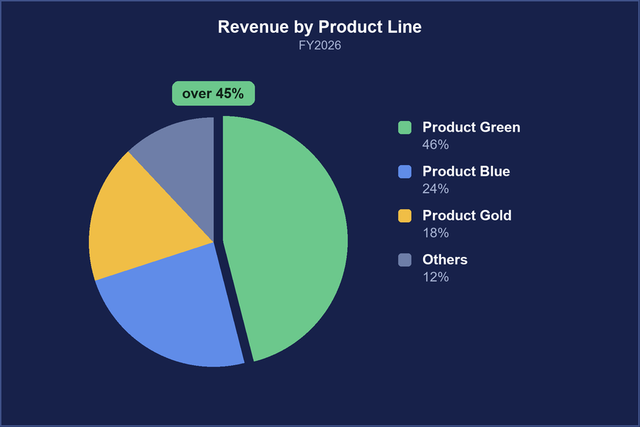
This green slice accounts for over 45% of total revenue.
この緑のスライス(部分)が総収益の45%以上を占めています。
- slice:(円グラフの)扇形の部分
- account for:~を占める
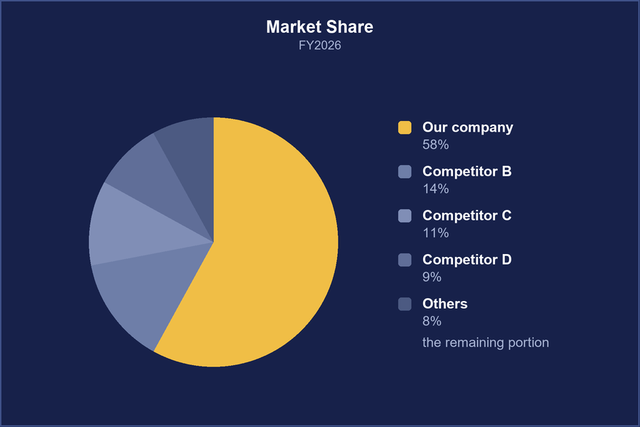
The remaining portion is divided among smaller competitors.
残りの部分は小規模な競合他社に分かれています。
- the remaining portion:残りの部分
- be divided among:~の間で分かれる
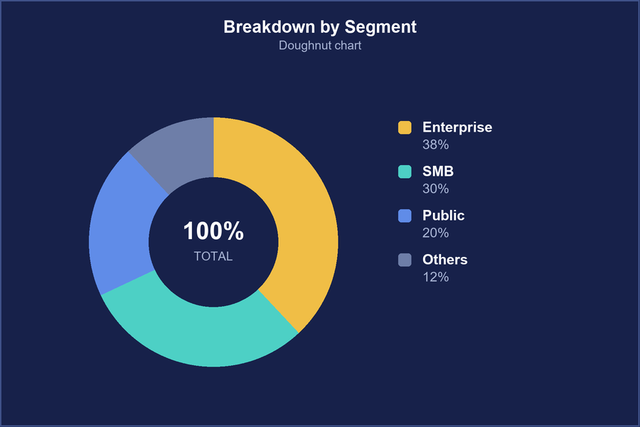
The breakdown highlights our main market segments.
この内訳は、当社の主要な市場セグメントを強調しています。
- breakdown:内訳
- market segment:市場セグメント
会議ではこう話す(4フレーズをつなげた説明例)
上の4フレーズ(太字)を1本の説明につなげると、こうなります。数字や名前は、自分の資料に合わせて入れ替えて使えます。
I have two pie charts. The first one shows our revenue by device. As you can see from this pie chart, mobile users dominate. This green slice accounts for over 45% of total revenue.
円グラフが2つあります。1つ目はデバイス別の売上です。この円グラフからわかるように、モバイルの利用者が中心です。この緑の部分が、売上全体の45%以上を占めています。
The second one shows market share in our category. We hold about a third, and the remaining portion is divided among smaller competitors, none of them above 5 percent.
2つ目は、この分野の市場シェアです。当社が約3分の1を持ち、残りは小さな競合各社に分かれていて、5%を超える会社はありません。
Taken together, the breakdown highlights our main market segments, so this is where we should focus next year's budget.
2つを合わせて見ると、この内訳から当社の主要な市場セグメントがはっきり分かります。来年の予算は、ここに集中させるべきです。
ポイント円グラフで言うのは「いちばん大きい部分」と「残り」の2つだけで十分です。割合は 45 percent のような数字のほかに、about a third(約3分の1)、nearly half(半分近く)のような言い方も覚えておくと、ぱっと話せます。
このあと聞かれやすい質問と、答え方
QWhat does 'other' include?「その他」には何が入っていますか?
AMainly smart TVs and game consoles. Each is under 3 percent, so we grouped them together.主にスマートテレビとゲーム機です。どれも3%未満なので、まとめて表示しています。
QIs that share of revenue or share of users?それは売上の割合ですか、利用者数の割合ですか?
ARevenue. By number of users, mobile is even higher, at about 60 percent.売上です。利用者数で見ると、モバイルはさらに高く、約60%です。
QHow has the mix changed from last year?昨年から構成はどう変わりましたか?
AMobile went up by about 8 percentage points, mostly at the expense of desktop.モバイルが約8ポイント増えました。ほとんどはパソコンからの移行です。
ポイント割合の「差」は percentage points(ポイント)で言います。45%から53%なら「8 percent 増えた」ではなく「8 percentage points 増えた」です。数字に強い相手ほど、ここを聞き分けます。
言い換えで伝わり方が変わる表現
| よくある言い方 | 伝わる言い方 | 理由 |
|---|---|---|
| 45% of all is mobile. | Mobile accounts for 45 percent of the total. | 主語を「モバイル」にして account for で言うと、英語として自然な順になる |
| Mobile is the most. | Mobile makes up the largest share. | 「いちばん多い」は make up the largest share(最大の割合を占める) |
| It increased 8%. | It increased by 8 percentage points. | 割合どうしの差は percentage points。8% と言うと「8%分増えた」と誤解される |
| Others are small. | The rest is split among several smaller players. | 「残りは小さな会社に分かれている」と、残りの構成まで言う |
一緒に覚えたい言葉
| 英語 | 意味 | 使い方の例 |
|---|---|---|
| share | 割合・シェア | Our market share rose to 34 percent. |
| slice / segment | (円グラフの)一切れ・区分 | The blue slice represents desktop users. |
| make up | (割合を)占める・構成する | Tablets make up just 8 percent of sales. |
| percentage point | (割合の差の)ポイント | Our share grew by two percentage points. |
| breakdown | 内訳 | Here's the breakdown by region. |
| the majority / a minority | 大部分 / 少数 | The majority of orders come from mobile. |
| doughnut chart | ドーナツグラフ | A doughnut chart leaves room for the total in the middle. |