
散布図・バブルチャートを英語で説明する
Scatter Plot & Bubble Chart
どんなときに使うグラフか
散布図・バブルチャートは英語で Scatter Plot & Bubble Chart。2〜3つの変数間の相関関係やデータのばらつきに使います。
会議やプレゼンでこのグラフを映したときに、そのまま言える4フレーズを用意しました。 導入・比較・着目点・締めの順に並んでいるので、上から読めば説明が1本つながります。
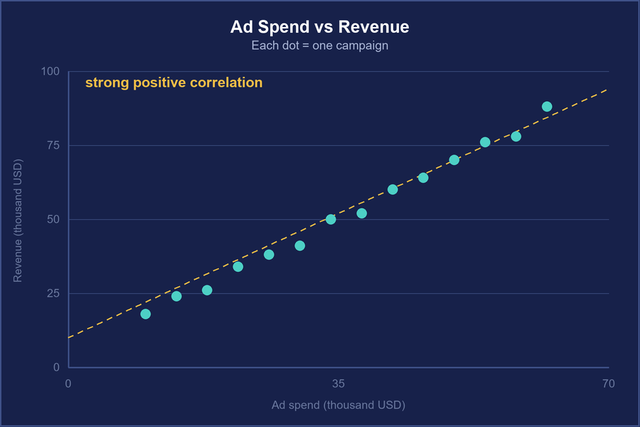
This scatter plot reveals a strong positive correlation.
この散布図は、強い正の相関関係を示しています。
- reveal:明らかにする
- positive correlation:正の相関
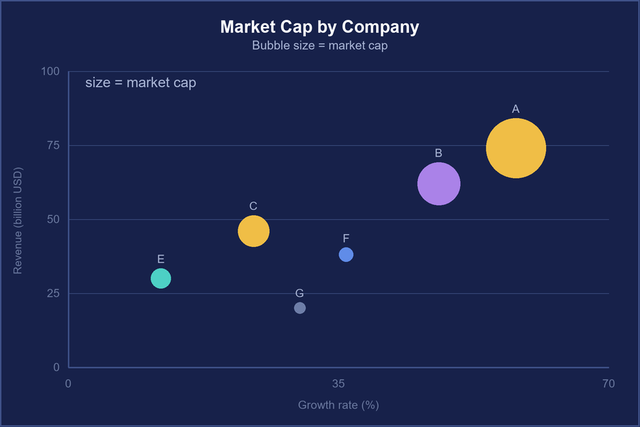
Each bubble's size indicates the company's market cap.
各バブルの大きさは、その企業の時価総額を表しています。
- indicate:示す
- market cap:時価総額
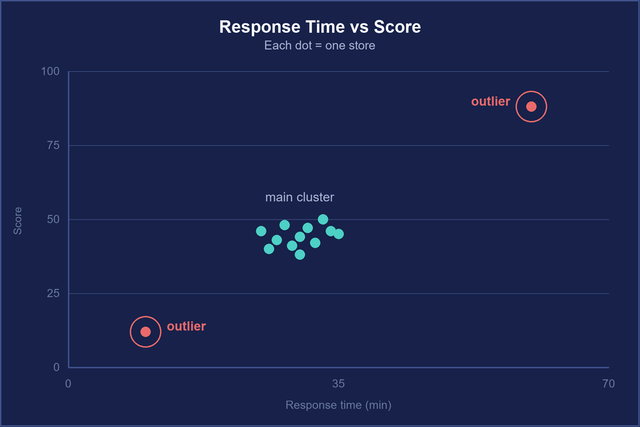
Notice these outliers situated far from the main cluster.
メインクラスタ(集団)から離れた位置にある外れ値にご注目ください。
- outlier:外れ値
- main cluster:主要な集団
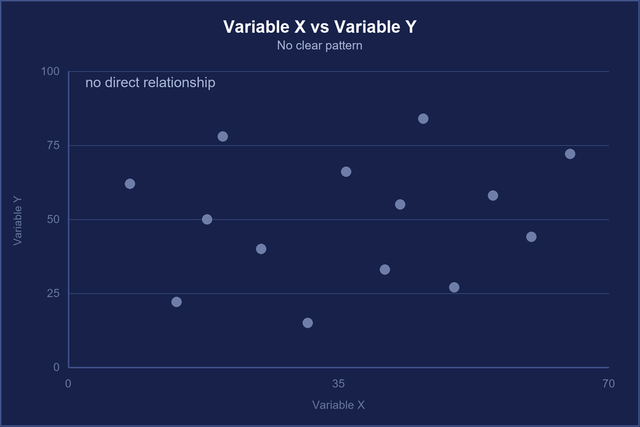
There is no direct relationship between these two variables.
これら2つの変数間に直接的な関係性は見られません。
- direct relationship:直接的な関係性
- variable:変数
会議ではこう話す(4フレーズをつなげた説明例)
上の4フレーズ(太字)を1本の説明につなげると、こうなります。数字や名前は、自分の資料に合わせて入れ替えて使えます。
We wanted to see whether local advertising actually drives store sales. This scatter plot reveals a strong positive correlation. The more a store spends on local ads, the higher its sales.
地域広告が本当に店舗の売上につながっているのかを確かめたいと考えました。この散布図からは、強い正の相関が分かります。地域広告に多く使う店ほど、売上も高くなっています。
Notice these outliers situated far from the main cluster. Those three stores are in airports, so their foot traffic is unusual.
主な集団から大きく離れた、この外れ値にご注目ください。この3店舗は空港の中にあるため、来店者数が特殊です。
In the bubble version on the next slide, each bubble's size indicates the company's market cap.
次のスライドのバブルチャートでは、バブルの大きさがその企業の時価総額を表しています。
Finally, we checked customer age against basket size, but there is no direct relationship between these two variables.
最後に、客の年齢と1回の購入額の関係も調べましたが、この2つの変数の間に直接の関係は見られませんでした。
ポイント散布図は「相関」を示すもので、「原因」まで示すものではありません。最後に This shows correlation, not necessarily causation.(相関であって、因果とは限りません)と一言添えると、数字に強い相手からの信頼が上がります。
このあと聞かれやすい質問と、答え方
QHow strong is the correlation?相関はどのくらい強いですか?
AThe correlation coefficient is about 0.8, so it's fairly strong.相関係数は約0.8なので、かなり強いと言えます。
QShould we exclude the outliers?外れ値は除くべきですか?
AI'd keep them on the chart but leave them out of the trend line, since they're airport stores.グラフには残しますが、空港店なので近似線の計算からは外すのがよいと考えます。
QDoes this prove that ads increase sales?これで広告が売上を増やすと証明できますか?
ANot on its own. It shows correlation, not causation. We'd need a controlled test to be sure.これだけでは言えません。相関であって因果ではないので、確かめるには比較実験が必要です。
ポイント「証明できるか」と聞かれたら、言い切らないのが正解です。Not on its own.(これだけでは言えない)と答えて、次に何をすれば確かめられるかを示すと、誠実に聞こえます。
言い換えで伝わり方が変わる表現
| よくある言い方 | 伝わる言い方 | 理由 |
|---|---|---|
| They have relation. | There's a strong positive correlation between ad spend and sales. | relation ではなく correlation。強さと向き(positive / negative)も一緒に言う |
| These points are strange. | These points are outliers. | 集団から外れた点は outlier。strange だと「データがおかしい」と聞こえる |
| Big bubble is big company. | The larger the bubble, the higher the market cap. | 「~ほど~」は The 比較級, the 比較級 の形で言うと、きれいに伝わる |
| No relation. | There's no clear relationship between the two. | 完全に否定せず no clear(はっきりした~はない)と言うほうが、分析として正確 |
一緒に覚えたい言葉
| 英語 | 意味 | 使い方の例 |
|---|---|---|
| correlation | 相関 | There's a weak negative correlation here. |
| causation | 因果関係 | Correlation doesn't prove causation. |
| outlier | 外れ値 | We removed two outliers from the analysis. |
| cluster | (点の)集まり | Most stores fall into one cluster. |
| trend line | 近似線・傾向線 | I added a trend line to make the pattern clear. |
| variable | 変数 | We compared two variables: price and volume. |
| correlation coefficient | 相関係数 | The correlation coefficient is 0.75. |